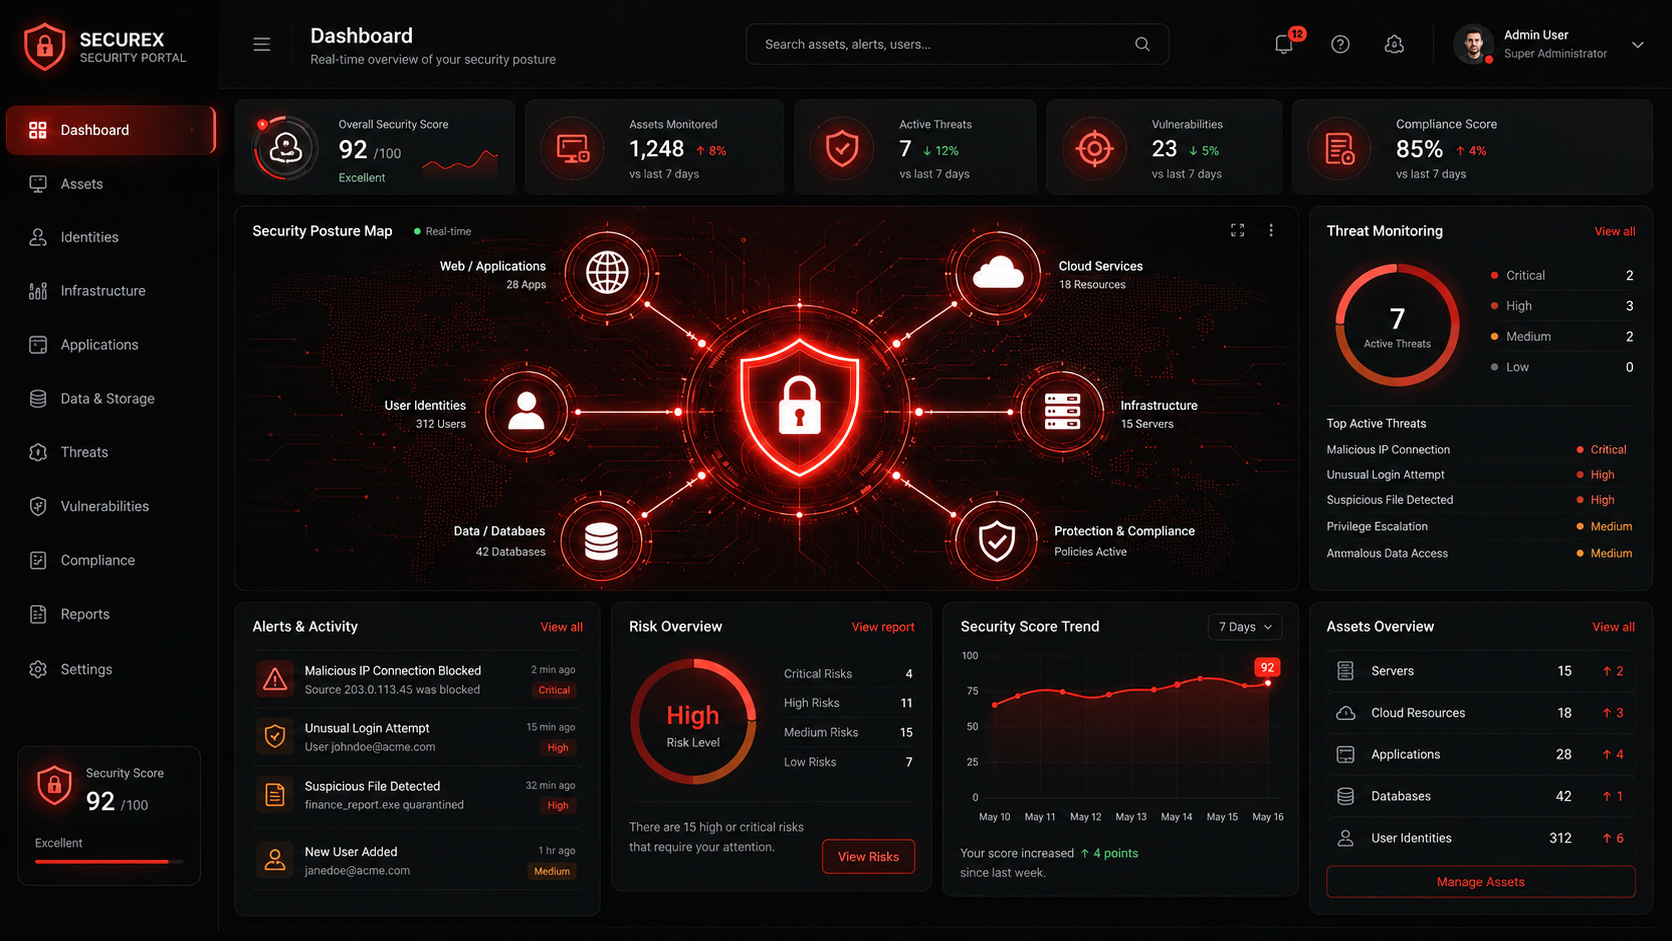
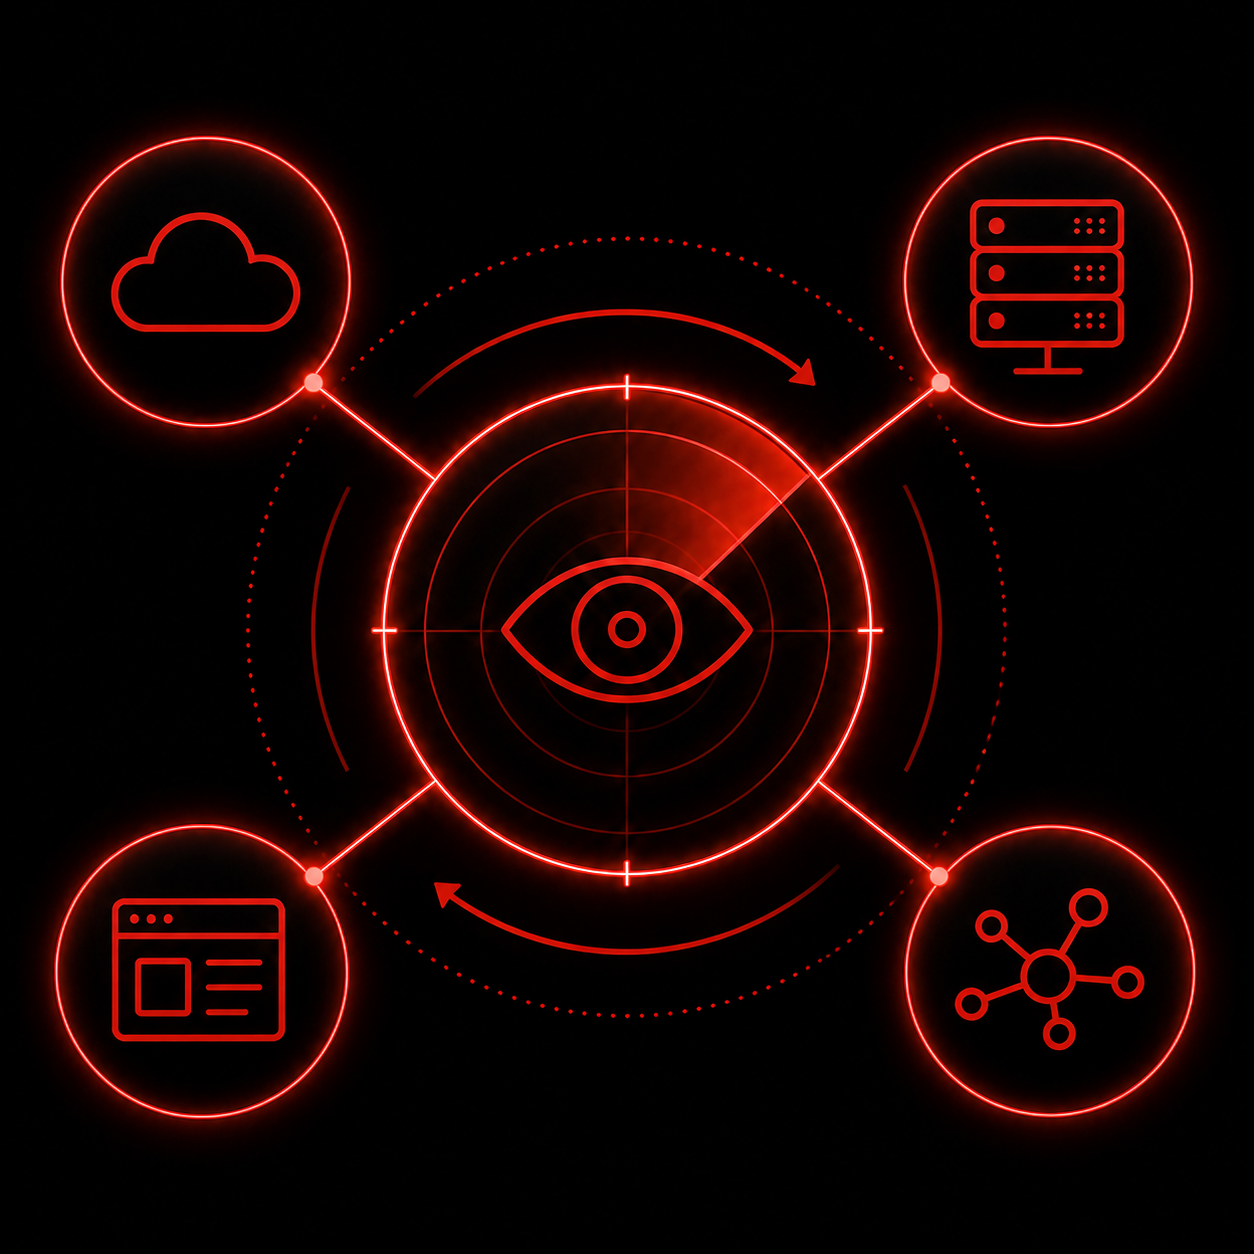
Visualize relationships between domains, applications, cloud assets, identities, and digital infrastructure to gain a deeper understanding of your organization’s attack surface.
Modern digital environments are highly interconnected. A single exposed asset can create
pathways to critical systems, applications, and sensitive information.
IDARK Sentinel’s Digital Assets Graph provides a visual representation of your digital
ecosystem, helping security teams understand how assets relate to one another and where
potential attack paths may exist.
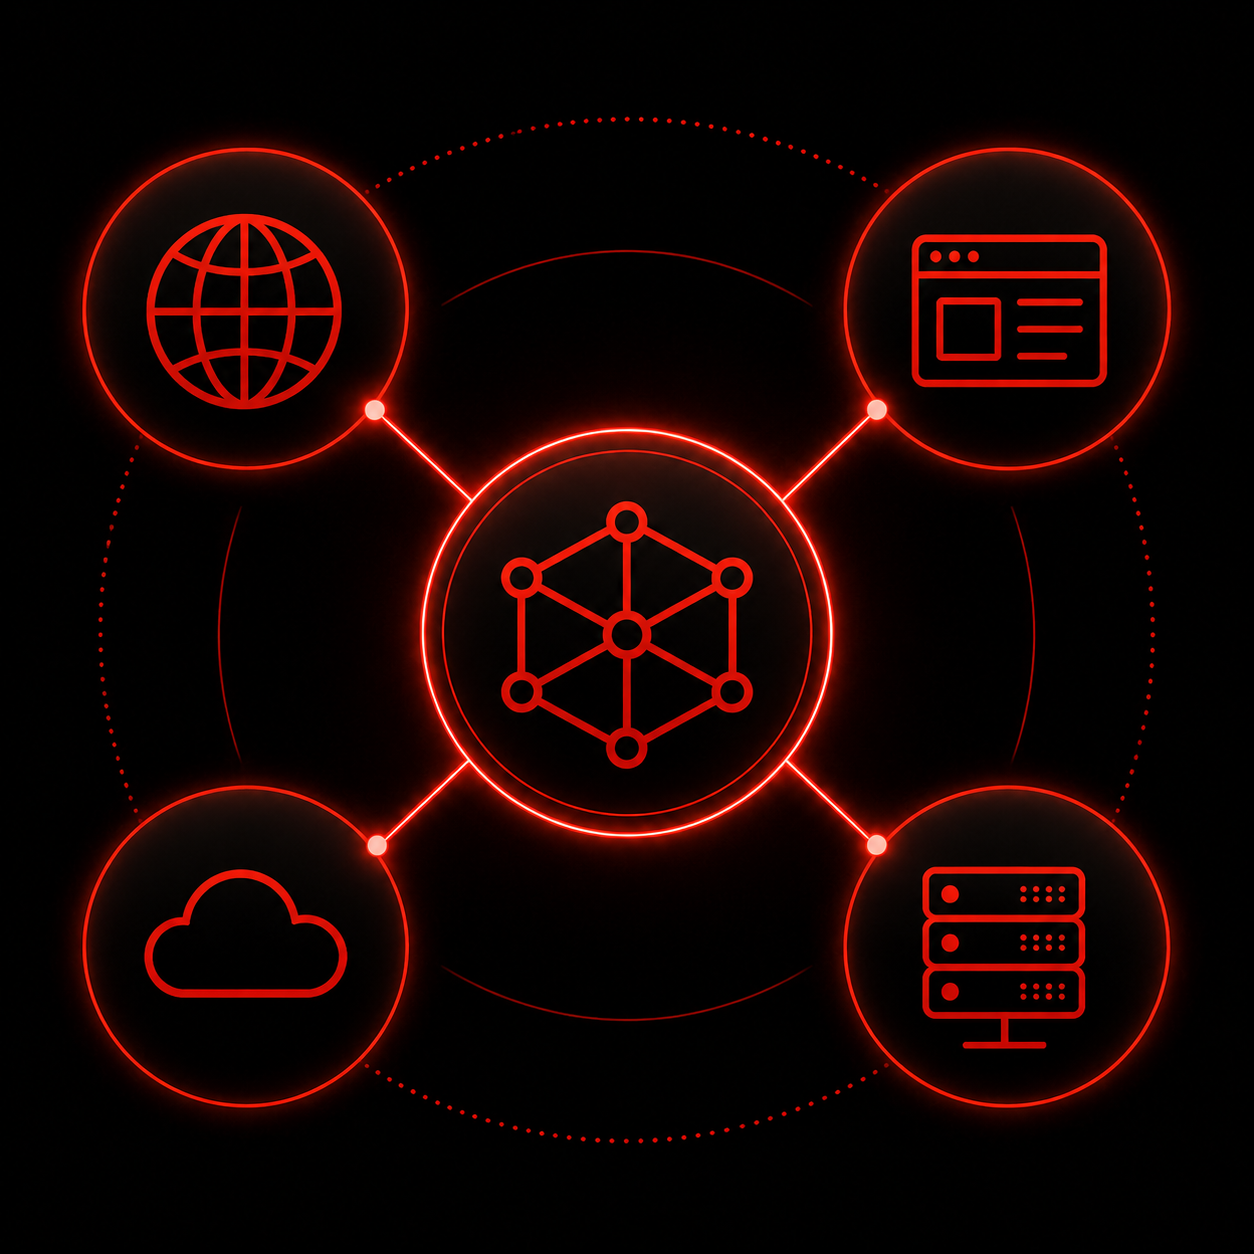
Visualize domains, applications, cloud resources, and connected assets.
Connect
Translate complex security data into meaningful risk scores.
Analyze
Understand how your security posture compares over time.
Strengthen
Improve visibility and security decision-making across your environment.
COMPLEX ENVIRONMENTS CREATE HIDDEN RISK
You Can't Secure What You Don't Understand.
As organizations expand their digital footprint, assets become increasingly connected across
cloud platforms, applications, third-party services, and business units.
Without visibility into these relationships, organizations face:
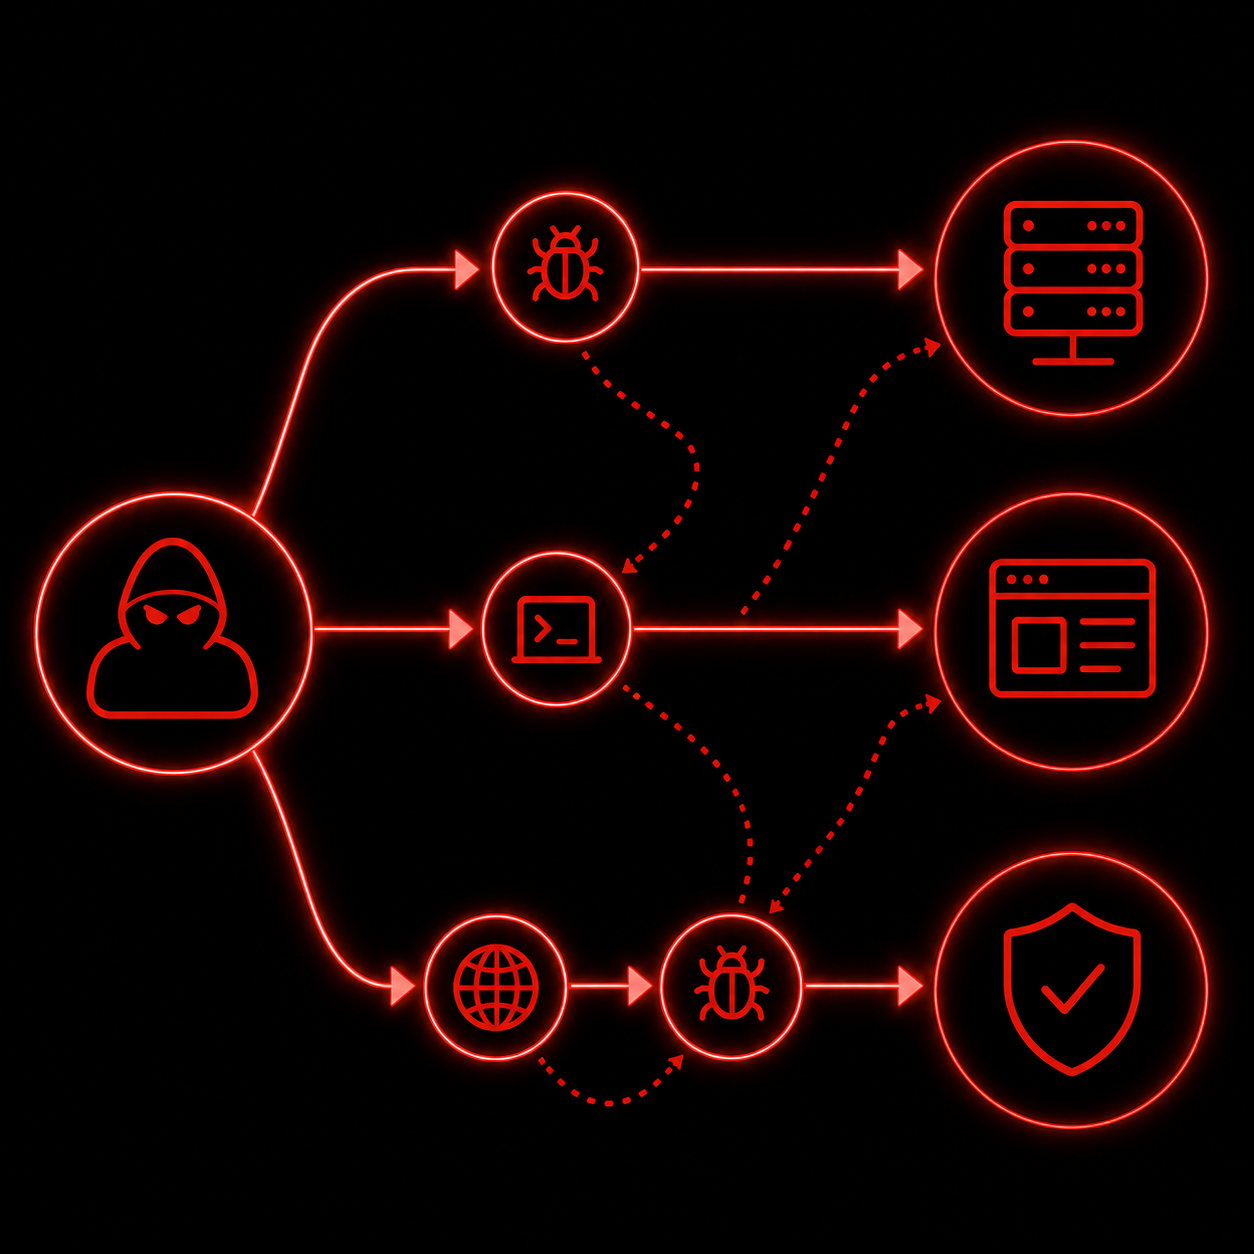
Attackers don’t see isolated assets. They see connected opportunities. Understanding those
connections is critical to reducing risk.
What You Get with IDARK360
IDARK Sentinel’s Digital Assets Graph provides contextual visibility into your digital ecosystem,
helping security teams understand how assets interact and where risk exists.
Asset Relationship Mapping
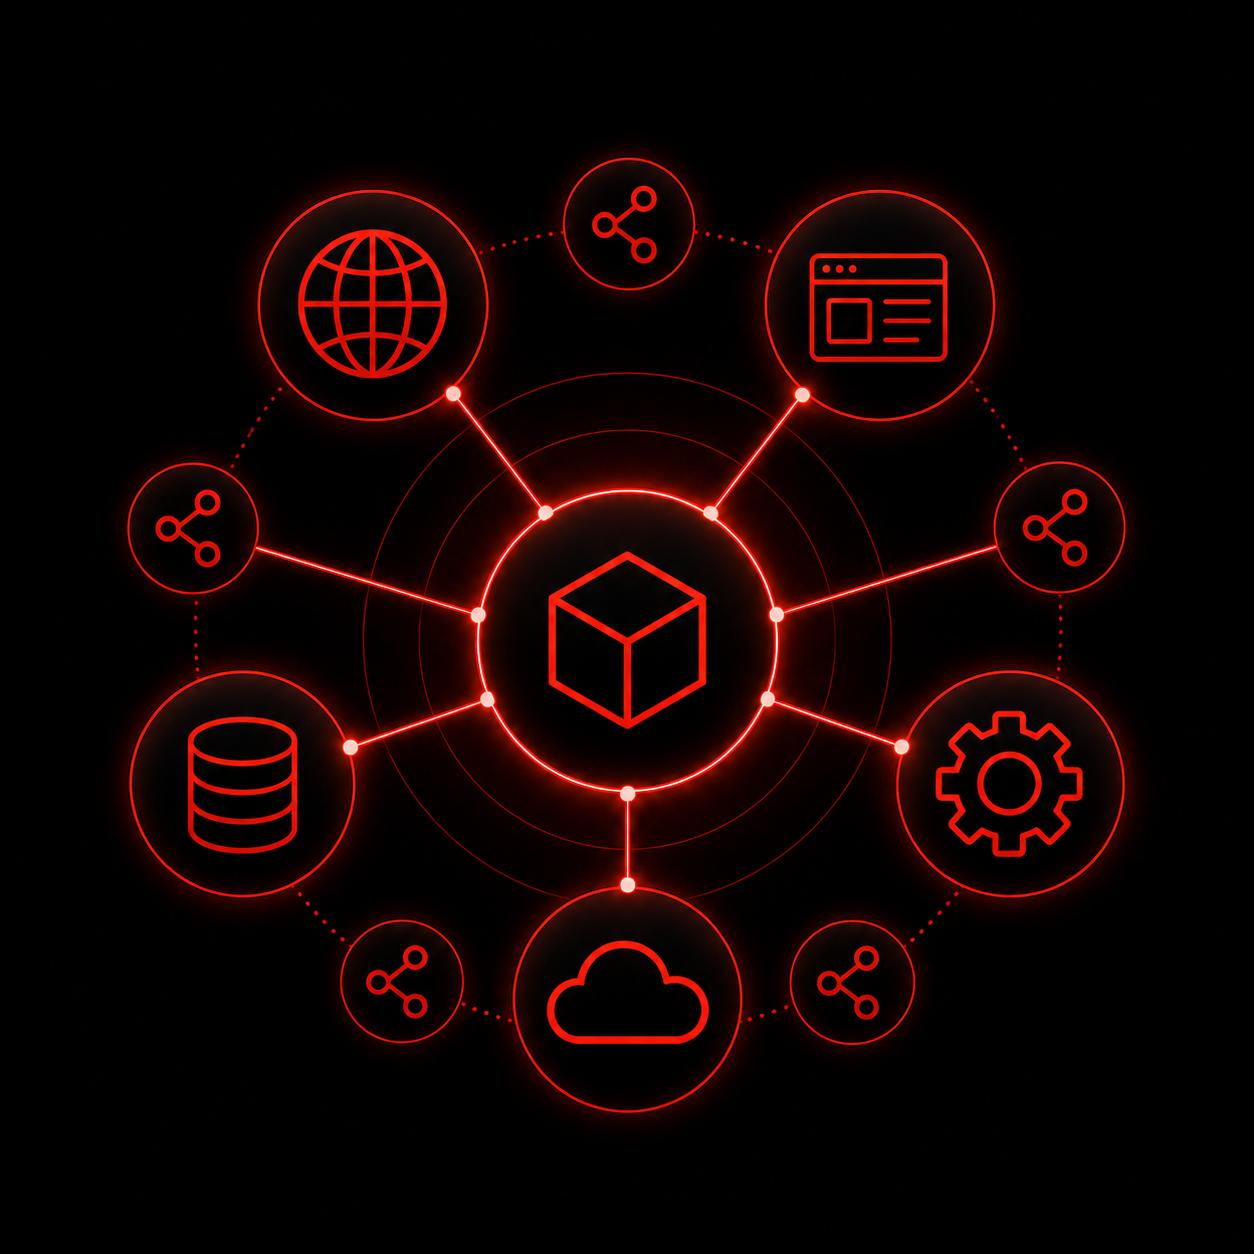
Visualize how domains, applications, cloud resources, and services connect.
Attack Path Visibility
Identify potential routes attackers may use to move through your environment.
Dependency Intelligence
Understand critical asset relationships and operational dependencies.
Continuous Environment Awareness
Maintain an up-to-date view of your evolving digital infrastructure.
SEE YOUR ENVIRONMENT AS A CONNECTED SYSTEM
Transform isolated asset data into actionable intelligence and gain the visibility needed to
reduce risk across your digital ecosystem.